| Daily Reports | ||||||
|---|---|---|---|---|---|---|
| Sunday | Monday | Tuesday | Wednesday | Thursday | Friday | Saturday |
| August 30 | August 31 | September 1 | September 2 | September 3 | September 4 | September 5 |
| September 6 | September 7 | September 8 | September 9 | September 10 | September 11 | September 12 |
Hi Glen and all,
We have updated the physics fields, plots and netcdf files, see http://mseas.mit.edu/Sea_exercises/QPE_IOP09/Maps/Sep07/index.html and http://mseas.mit.edu/Sea_exercises/QPE_IOP09/Maps/Sep08/index.html. These forecasts assimilate data up to survey 8, 1000Z Sep 07 (for the ocean physics).
As a whole, the cold dome continues to erode to the northeast, with several eddies continuing to detach to the north. It seems it takes about 2 days for eddies to detach. You see them in the drifter tracks.
The assimilation of survey 8 seemed to modify the phase of internal tides (making them broader) and may have accelerated the eddying process to the north. It has also corrected the deep (100m salinities) bringing them back to what our simulations had there on Sep 03. The advection of saltier water at the location of survey 8 in the time period Sep 03 to Sep 06 may have been produced by several factors, including somewhat off atmospheric forcing forecasts (COAMPS) or our own Kuroshio strength estimate. I also believe that our barotropic tidal forcing at the tip of Taiwan are a bit too strong, which leads to uncertainties. All this together, as I emailed, we had larger uncertainties at that location of survey 8 and further to the north-northwest of that location. Note that my hypothesis I) below is still also possible, you may have hit an internal tide (they don't advect fast) while sampling the survey 8.
To illustrate the variability of the "cold dome" over twelve hours, I attach temperature forecasts at 50m from 00Z Sep 8 to 12Z Sep08.
I also attached the two uncertainty std maps in the region at 50m, on 00Z Sep 08, - prior - to the Survey 8 assimilation. Things are quite uncertain as you may see!!! We have not yet plotted the uncertainty after the assimilation of survey 8, but we plan to do this later tonight.
The daily summary forecasts page are: http://mseas.mit.edu/Sea_exercises/QPE_IOP09/Summaries/Sep07/index.html and http://mseas.mit.edu/Sea_exercises/QPE_IOP09/Summaries/Sep08/index.html. On that page, you have a link to a tar file with everything including the html.
For forecast zoom estimates, including velocities which could be useful for OMAS run planning, see:
http://mseas.mit.edu/Sea_exercises/QPE_IOP09/Maps/Sep08/025mZ/index.html
http://mseas.mit.edu/Sea_exercises/QPE_IOP09/Maps/Sep08/050mZ/index.html
Jinshan has also forecast the Canyon behavior with the Nx2D approach that we discussed with Ying-Tsong. See the results in: http://mseas.mit.edu/Sea_exercises/QPE_IOP09/Acoustics/Canyon/index.html
Best wishes,
Pierre
Hellow Glen,
Thanks. Thanks a lot for the good data! We had high uncertainty in that region, so this is great. Thanks to the whoi support and OR1 crew too.
I am as puzzled as you are since conditions seem different. This is good, we should learn from it. This is the Q of QPE!
A few very preliminary ideas:
Assuming you stayed long enough on the western edge of your survey (3 to 6 hours), the internal tides are unlikely. This means that the Kuroshio acceleration and deceleration is perhaps a better guess. It will take time to figure this one out.
We have launched new forecasts (as you know we made a typo last night so a file that did not exist killed the runs). We also have uncertainty fields. Once they are done, we will let you know.
The Canyon plan is good.
Thanks a lot again for the data!!
Pierre
Hi Tim,
Thanks for the news.
I just quickly looked at the Seasoar survey, they should be very helpful. Thanks a lot.
In the predictions, the "cold dome" has been eroding to the northeast and it now looks more or more looks like a patch of eddies and filaments, modulated by strong tides and waves. I have also seen some low salinity bands coming in from I-Lan (this may happen when the Kuroshio decelerates, by ageostrophic vertical velocity cells) . We have a lot of uncertainty at the cold dome inflow area in our estimates, so the data will help a lot. In any case, I hope we went northwest enough to be sure on the dome.
Thanks,
Pierre
Adaptive Sampling Recommendations
Hi Glen,
For the Cold dome survey, I made some suggestions in my "Ocean Physics Forecast, update up to 08 Sep 00Z, 2009" email.
In your plan, you have:
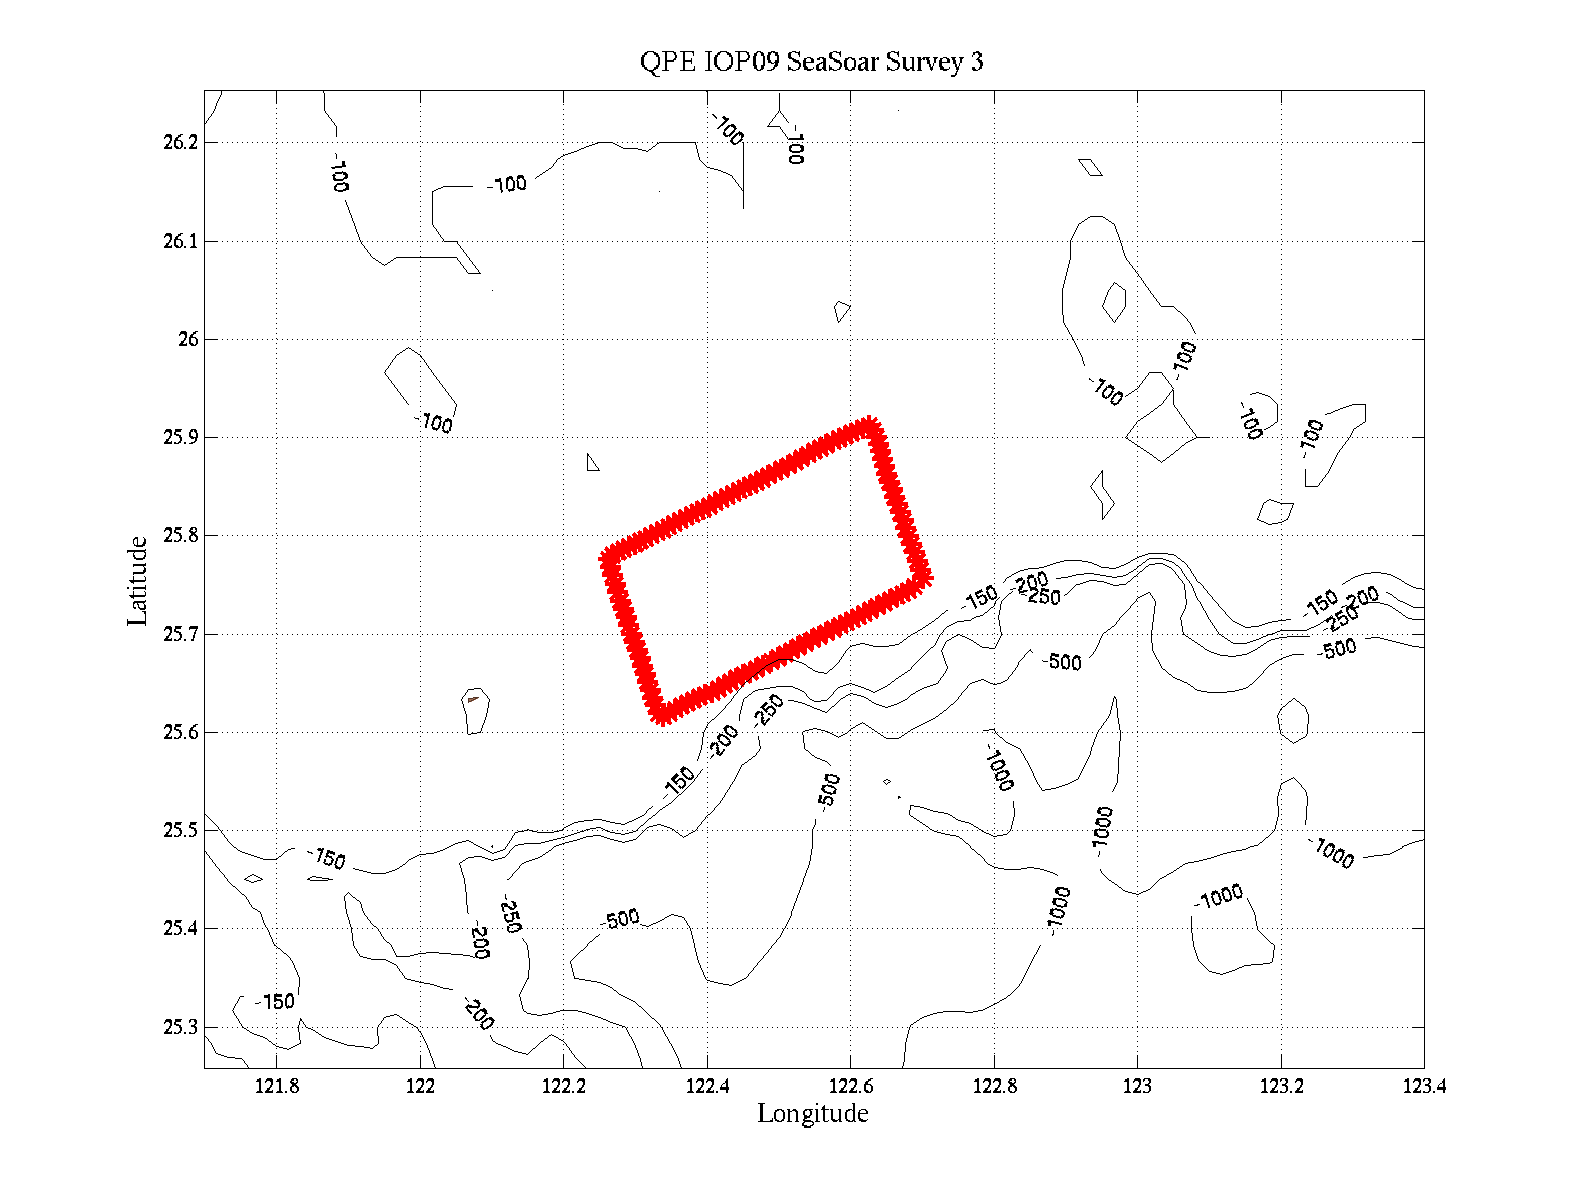
September 7- Day 0600-1800 SeaSoar Operations Repeat of Survey 3 of Leg 1 in center of Cold Dome. Adjust as needed for Cold Dome structure and/or Kuroshio Intrusion. Along-shelf lines at 130 m isobath and further onshore to determine Cold Dome structure, adaptive.
|
|
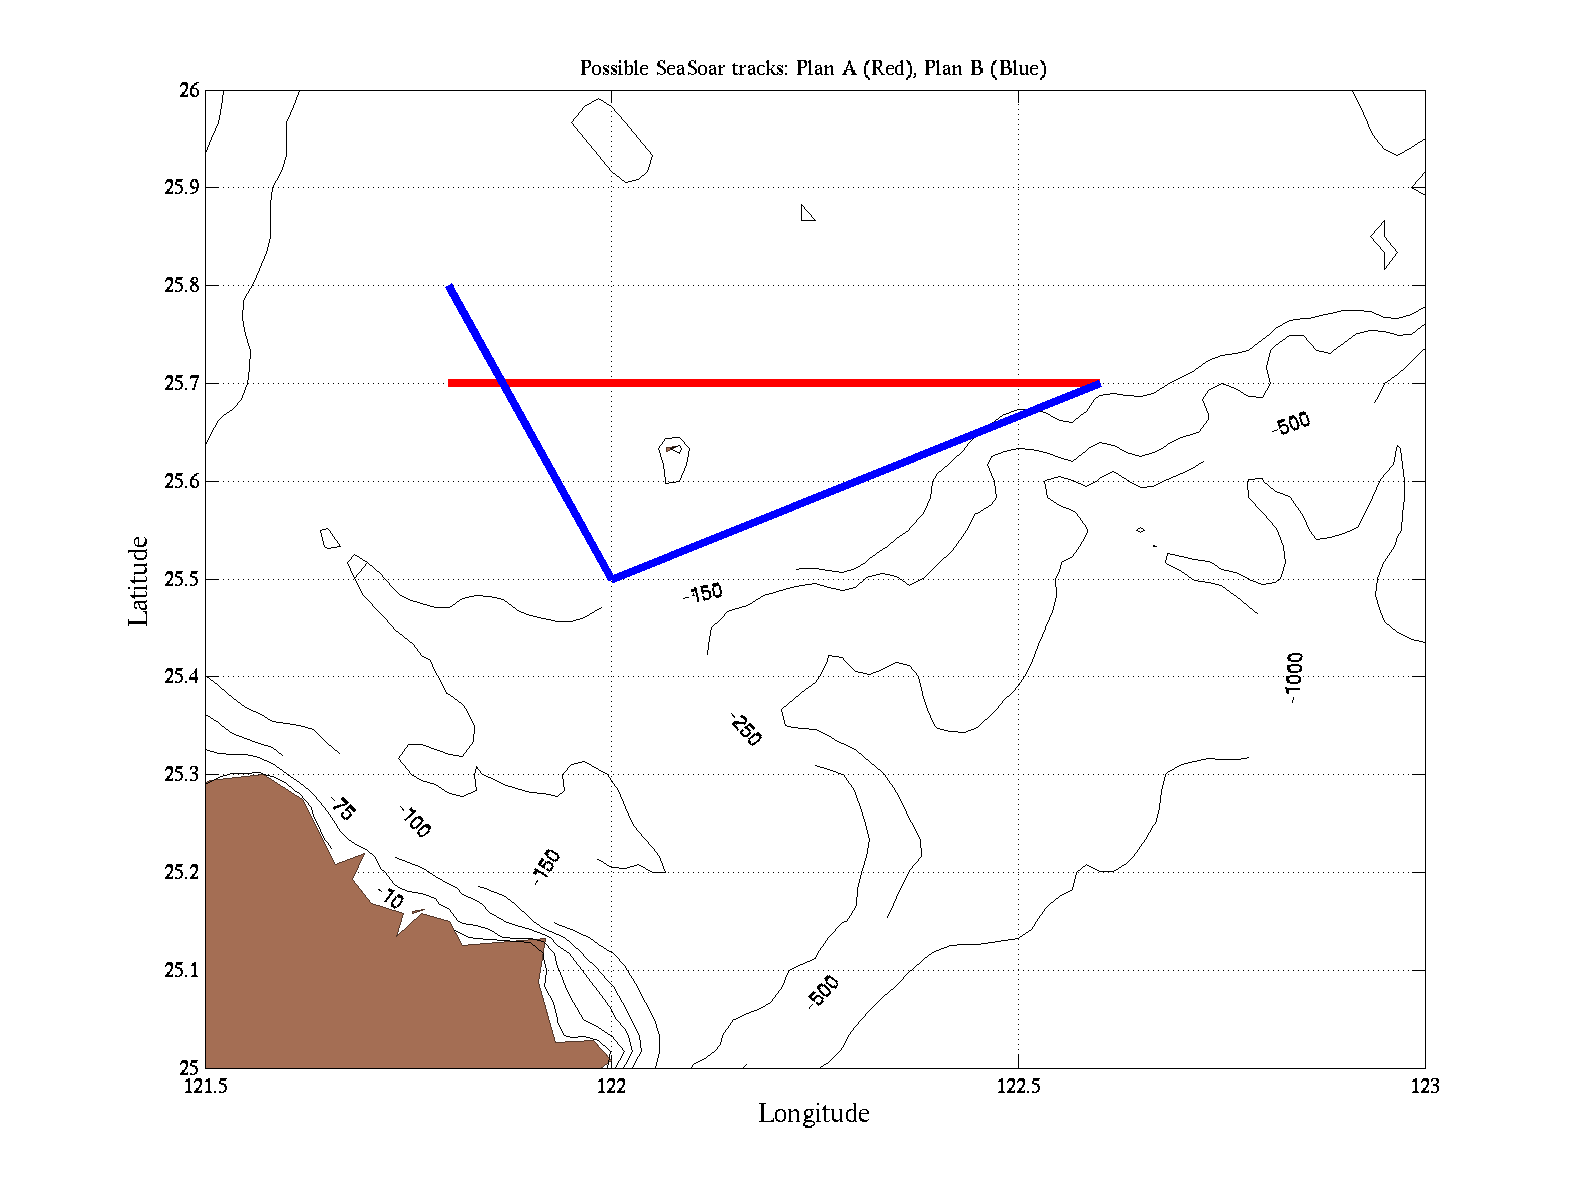
To answer some outstanding questions about the Cold Dome, I would modify survey 3, so as to go further west (double the distance to the west, perhaps doing only 2 sides of the rectangle and not four of them. In my physics summary, I was suggesting to either go along along 25.7N (from 122.6 to 121.8) or towards the NM Canyon (along bathy to NM, then north to 25.7-25.8).
Here are possible coordinates: either Plan A: (25.7,122.6) to (25.7, 121.8) or Plan B: (25.7,122.6) to (25.5, 122) to (25.8, 121.8)
These are likely long for you, but you could cut the parts in these plans that you have already sampled yesterday. We are also working on ocean uncertainty estimates and we plan to email you later today or tomorrow.
For the OMAS runs for the cold dome for tonight CST, one idea is to do runs in with a nonzero west-east projection (to cross the cold dome). We have all the model outputs on the web. As you reach it, you should have better propagation I assume due to lower T up to 20m (or at least you will get a different prop). You could also do two parallel runs, one in the cold dome and one just outside of it. (or two runs that follow each other, one that gets in the cold dome before the other).
Here are how things look in the ocean forecast:
At 25m (below the well mixed layer):
http://mseas.mit.edu/Sea_exercises/QPE_IOP09/Maps/Sep06/025mZ/ccnt_T025_07Sep15z.gif
http://mseas.mit.edu/Sea_exercises/QPE_IOP09/Maps/Sep06/025mZ/ccnt_T025_07Sep18z.gif
http://mseas.mit.edu/Sea_exercises/QPE_IOP09/Maps/Sep06/025mZ/ccnt_T025_07Sep21z.gif
At 50m,
http://mseas.mit.edu/Sea_exercises/QPE_IOP09/Maps/Sep06/050mZ/ccnt_T050_07Sep15z.gif
http://mseas.mit.edu/Sea_exercises/QPE_IOP09/Maps/Sep06/050mZ/ccnt_T050_07Sep18z.gif
http://mseas.mit.edu/Sea_exercises/QPE_IOP09/Maps/Sep06/050mZ/ccnt_T050_07Sep21z.gif
Thanks,
Pierre
Hi Glen and all,
We have updated the physics fields, plots and netcdf files, see http://mseas.mit.edu/Sea_exercises/QPE_IOP09/Maps/Sep06/index.html These forecasts assimilate data up to 1400Z Sep 05 (for the ocean physics).
The ocean forecasts for 00Z Sep 6 to 00Z Sep 7 continue to show parts of the cold dome being advected to the northeast, leading to some elongation in that direction. The latest Seasoar survey may have hit its boundaries (or at least a boundary of a cold dome band/branch) but it is hard to be sure without data further to the west-southwest. See your survey here: http://mseas.mit.edu/Sea_exercises/QPE_IOP09/Data/SeaSoar/index_seasoar_data.html
The daily summary forecast is:
http://mseas.mit.edu/Sea_exercises/QPE_IOP09/Summaries/Sep06/index.html
On that page, you have a link to a tar file with everything including the html.
For forecast zoom estimates, including velocities which could be useful for OMAS run planning, see:
http://mseas.mit.edu/Sea_exercises/QPE_IOP09/Maps/Sep06/025mZ/index.html
http://mseas.mit.edu/Sea_exercises/QPE_IOP09/Maps/Sep06/050mZ/index.html
The barotropic tides and internal tides description of yesterday is still valid for the next 2-3 days (spring tides), so I won't repeat. The fields in the two links above show this.
Instead, let's focus closer to the bottom, for example at 100m:
http://mseas.mit.edu/Sea_exercises/QPE_IOP09/Maps/Sep06/100mZ/index.html.
One can then see the deeper Kuroshio water that has upwelled on the shelf in the past 1-2 weeks. On the shelf-shelfbreak, temperatures are around 15 to 18 at this depth, see for example:
http://mseas.mit.edu/Sea_exercises/QPE_IOP09/Maps/Sep06/100mZ/ccnt_T100_06Sep00z.gif
http://mseas.mit.edu/Sea_exercises/QPE_IOP09/Maps/Sep06/100mZ/ccnt_T100_06Sep03z.gif
http://mseas.mit.edu/Sea_exercises/QPE_IOP09/Maps/Sep06/100mZ/ccnt_T100_06Sep06z.gif
which are close to the times of the Seasoar 7 survey.
Salinities are around 34.5 to 35.7, see (with a different velocity scale):
http://mseas.mit.edu/Sea_exercises/QPE_IOP09/Maps/Sep06/100mZ/ccnt_S100_06Sep00z.gif
http://mseas.mit.edu/Sea_exercises/QPE_IOP09/Maps/Sep06/100mZ/ccnt_S100_06Sep06z.gif
One can clearly see the hard eastern turn the Kuroshio needs to do at this depth, see:
http://mseas.mit.edu/Sea_exercises/QPE_IOP09/Maps/Sep06/100mZ/ccnt_V100_06Sep00z.gif
http://mseas.mit.edu/Sea_exercises/QPE_IOP09/Maps/Sep06/100mZ/ccnt_V100_06Sep06z.gif
and for the longer forecast, see:
http://mseas.mit.edu/Sea_exercises/QPE_IOP09/Maps/Sep06/100mZ/ccnt_V100_07Sep21z.gif
For the ocean adaptive sampling, I would try to do some seasoar line as west as possible, for example along 25.7N or towards the NM Canyon.
With Kevin and Ying-Tsong, we are working on the adaptive sampling and acoustics forecasts using these new ocean forecasts.
Best wishes,
Pierre, Pat, Wayne and Jinshan
Hi Glen and Chris,
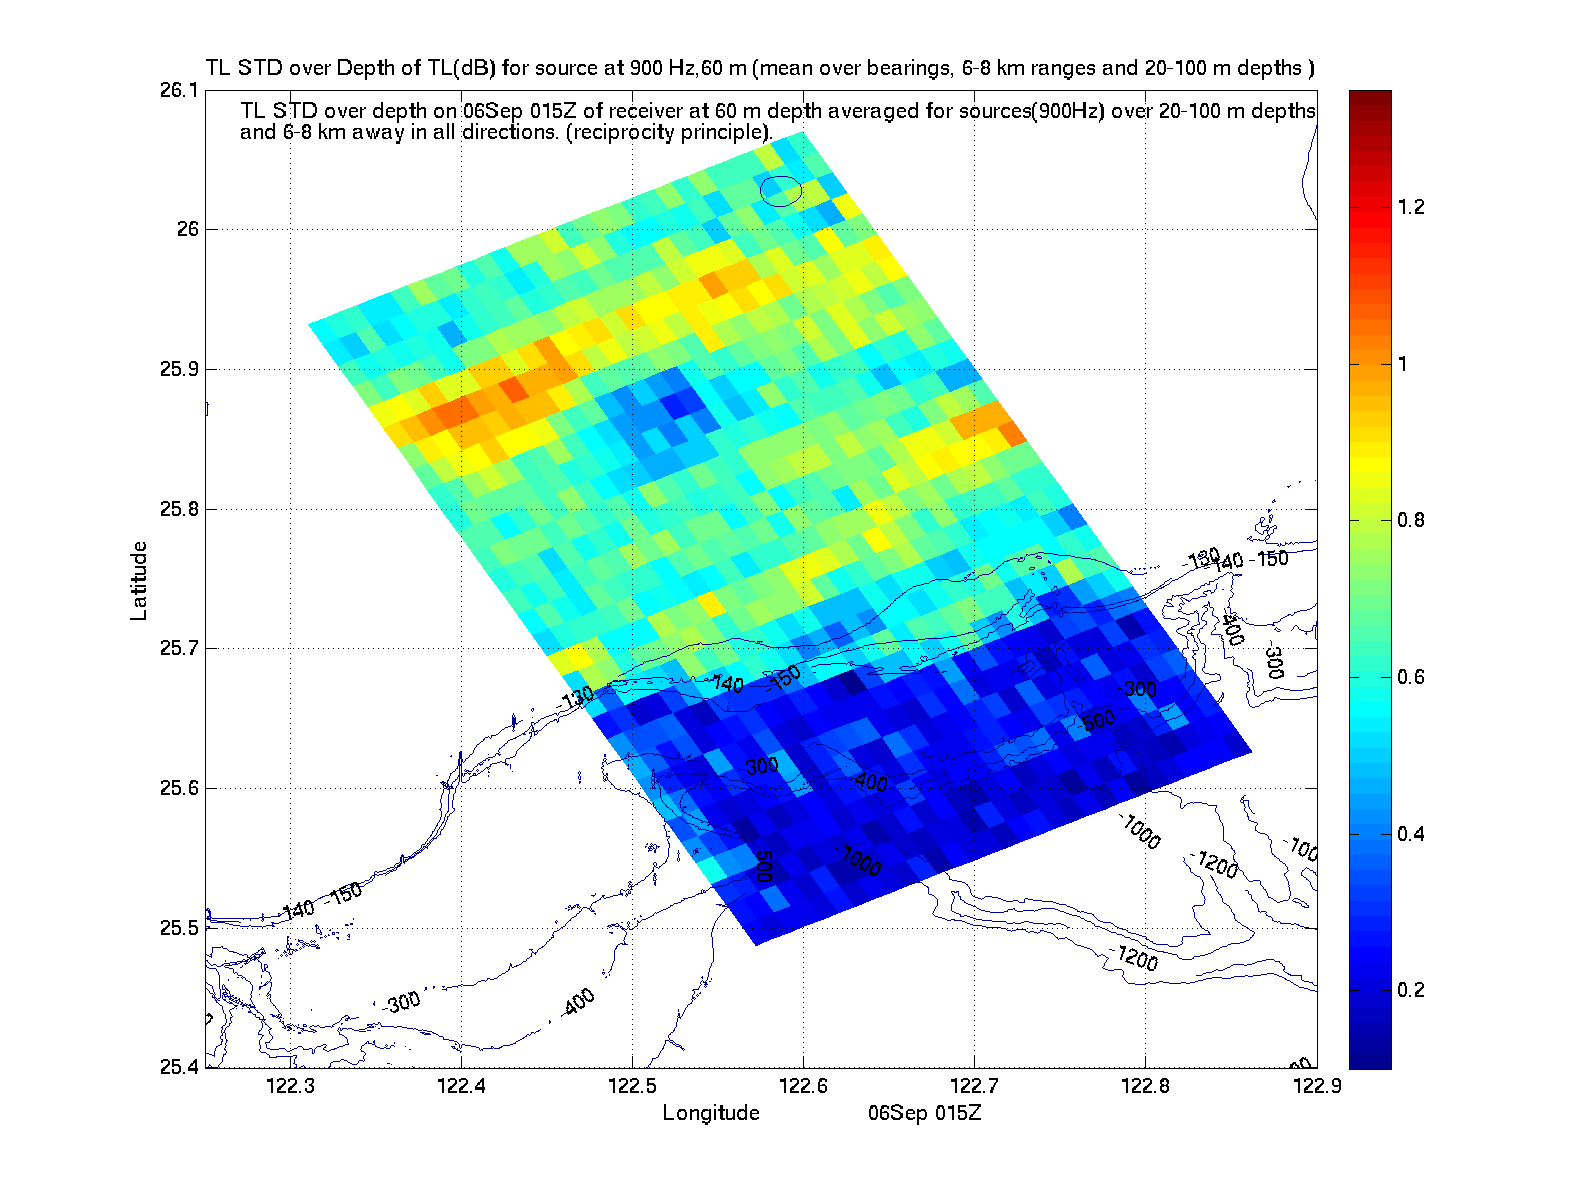
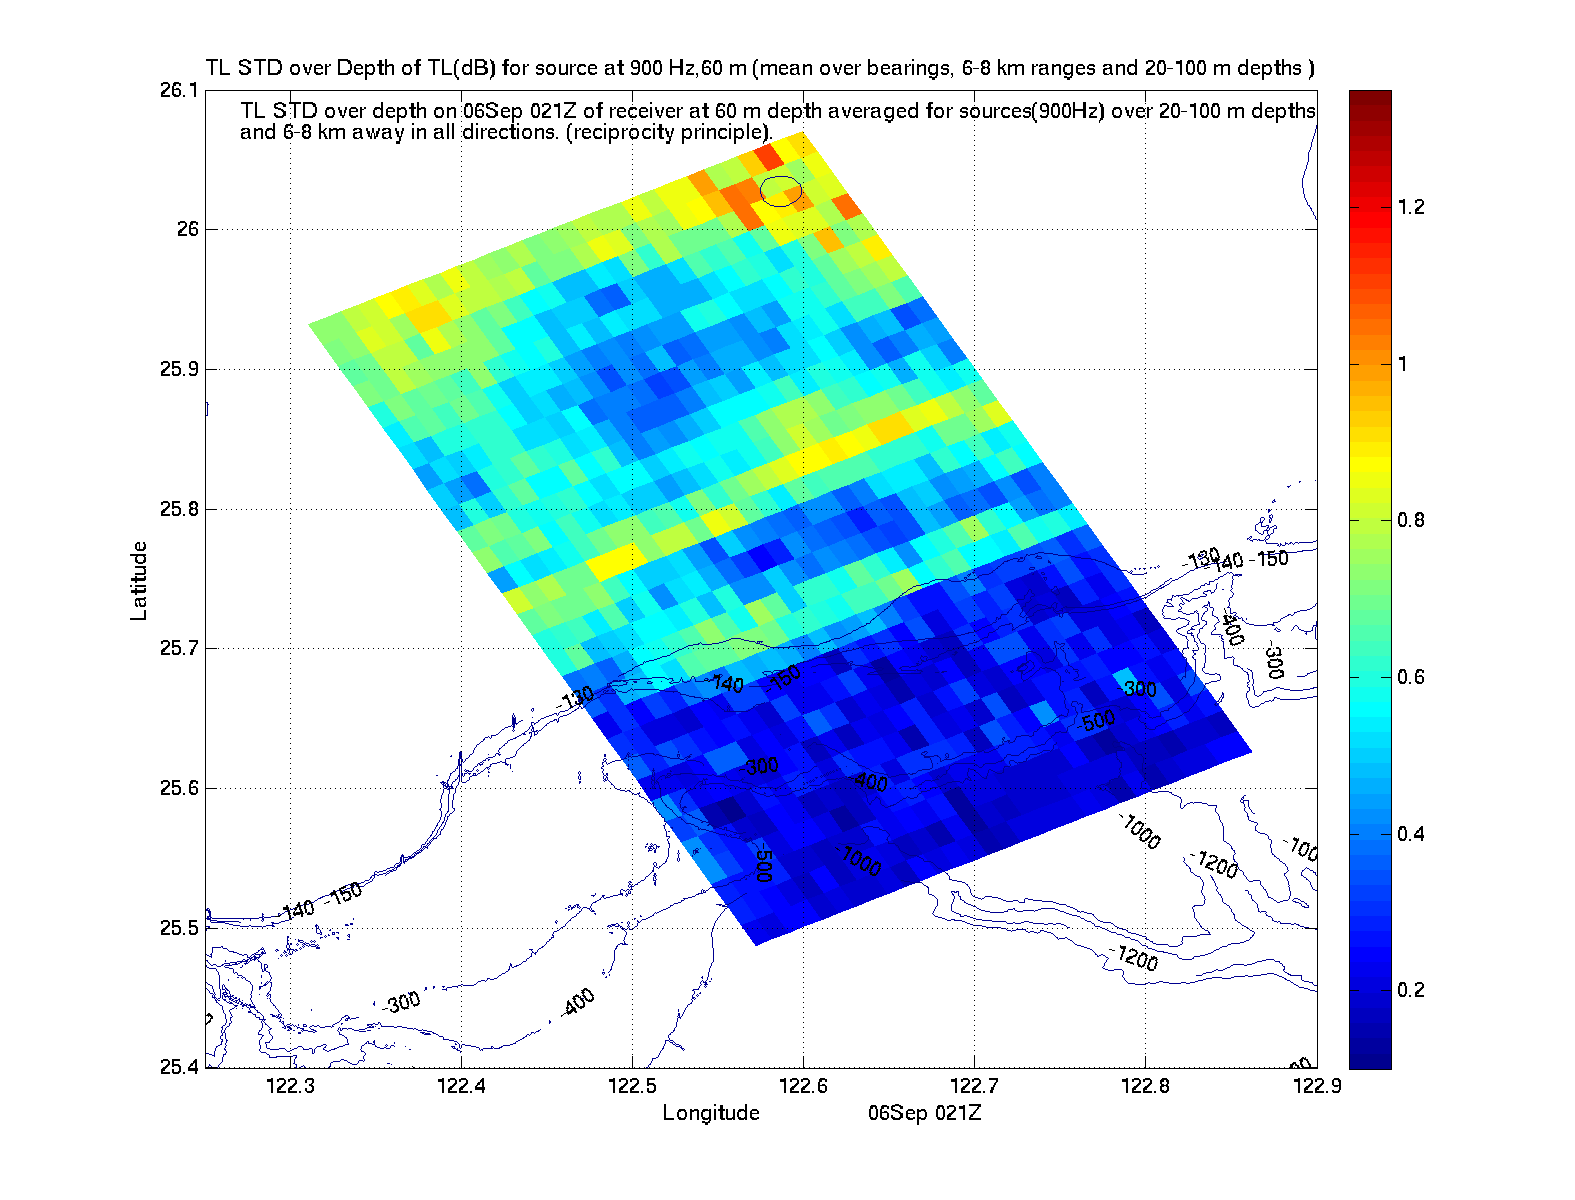
We have posted the acoustic predictions for day 3, a cross-slope event in the cruise plan. These acoustic predictions are for Sep 06 15Z, 18Z and 21Z.
Attached is the forecast expected Range (km) in the cross-slope direction on Sep 06 15Z for a source at (xs,ys) , i.e. this is the Mean Range on 06Sep 15Z at which TL in the cross-slope direction drops to 60±5 db averaged over 20-100 m depths, for source at 900Hz, 60m. The variability in space of these results seem to match those of Kevin. The mean ranges maybe a bit off, they depend on the bottom we use which Jinshan and I estimated (using the QPE Pilot data) to be, "for a depth < 140m: Sand sediment (sound speed ratio: 1.038, ρ: 1.90 g/cm3, α: 0.9 dB/λ)". Let us know what you find.
I also included the standard deviation of the TL in depth, with respect to a mean defined as "TL for source at 900Hz, 60m averaged over all bearings, 6-8km ranges and 20-100m depths". Here, the variability in time is interesting.
 |
 |
|
|
All of these results seem to match well with Kevin GA's plans and suggestions, so I also suggest to do Kevin's plan (western side). This assumes the ocean forecasts and bottom estimates are not too bad, but the Seasoar data should help us find out what is right/wrong, so we all win with this choice.
Best wishes,
Pierre
Hi Glen and all,
As you know, we have updated the physics fields, plots and netcdf files, see http://mseas.mit.edu/Sea_exercises/QPE_IOP09/Maps/Sep05/index.html. These forecasts assimilate data up to 0800Z Sep 04 (for the ocean physics).
The ocean forecasts for 00Z Sep 5 to 00Z Sep 7 show parts of the cold dome being advected east-northeast slowly in the next days. Its borders seem to soon reach the acoustic and Seasoar boxes from their western/northwestern sides (at least at 50m). The Cold dome waters forecast to be formed last week are now becoming more elongated to the east-northeast in the area.
The daily summary is:
http://mseas.mit.edu/Sea_exercises/QPE_IOP09/Summaries/Sep05/index.html.
On that page, you have a link to a tar file with everything on that page including the html of that page.
For forecast zoom estimates, including velocities which could be useful for OMAS run planning, see:
http://mseas.mit.edu/Sea_exercises/QPE_IOP09/Maps/Sep05/025mZ/index.html.
http://mseas.mit.edu/Sea_exercises/QPE_IOP09/Maps/Sep05/050mZ/index.html.
In the next three days, barotropic tides are forecast to be the highest (spring tides, see tidal products page or tar file we gave you).
This leads to strong northwest then southeast currents, oscillating at tidal frequencies. We should pay attention to these strong current forecasts for
OMAS mission planning. Internal tides (and likely also solitons/bores) are thus also forecast to be strong. For our good friend Tim Duda, "focusing"
on such internal tidal wave effects combined with eastward advections, our forecast shows a cold dome that is becoming more patchy and more
elongated to the east-northeast, especially for its close-to-surface signatures: look for example at this forecast evolution:
http://mseas.mit.edu/Sea_exercises/QPE_IOP09/Maps/Sep05/025mZ/ccnt_T025_05Sep00z.gif
http://mseas.mit.edu/Sea_exercises/QPE_IOP09/Maps/Sep05/025mZ/ccnt_T025_06Sep00z.gif
http://mseas.mit.edu/Sea_exercises/QPE_IOP09/Maps/Sep05/025mZ/ccnt_T025_07Sep00z.gif
Overlaid vectors are total (unfiltered) velocities. I am actually amazed how these Cold dome estimates and the ones forecast in the past days (see also 50m) look somewhat statistically similar to the high-res SST data that David Tang has in his older paper.
|
For some quick-look skill evaluations, I have attached a plot I made from Craig Lee's glider SG167 and the UW software. This glider is getting very close to the N-MH Canyon from the east side. The plot shows the vertically integrated currents it measures. It shows the Kuroshio it crossed recently, then the westward onshore flow we had forecast, than I believe some tidal effects as the glider gets closer to the shelbreak. In the past hours, due to tidal effects, currents were there forecast west-southwest, see:
http://mseas.mit.edu/Sea_exercises/QPE_IOP09/Maps/Sep05/050mZ/ccnt_T050_05Sep18z.gif
which seems to match the glider velocity data.
We are working on the acoustics forecasts using these new ocean forecasts Kevin has already given his GA predictions using our ocean forecast fields.
Best wishes,
Pierre
Hi Glen and Chris,
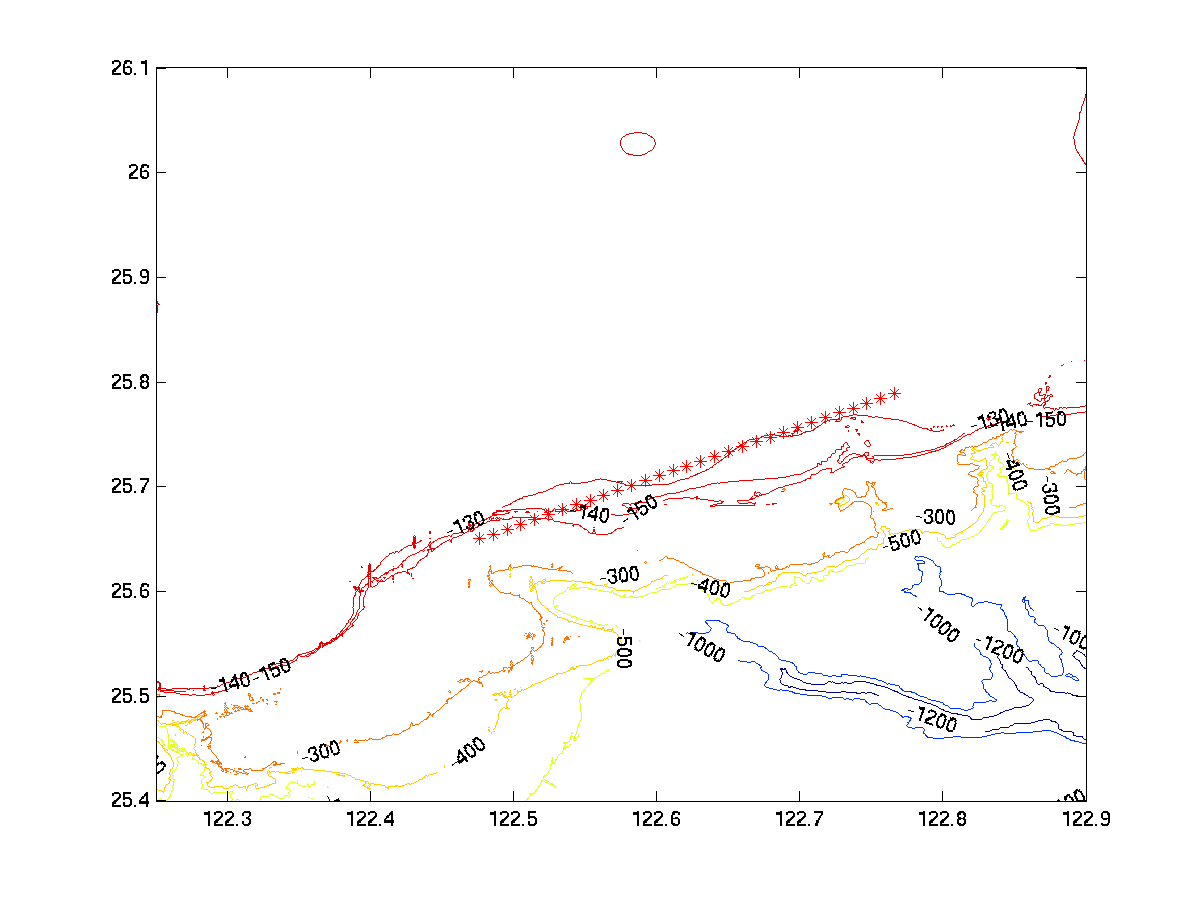
Please find attached the acoustic forecast and adaptive sampling suggestion for day 2, a 130m isobath run (as in the modified cruise plan). The predictions attached are for 15Z, Aug 05, which is 2300 CST. To reduce email load, next I will email only both of you and Phil the forecasts for 18Z and 21 Z on Aug05 (later in the night in CST). I assume you can distribute these forecasts on the ship (all plots will be on the web). As yesterday, all of the information is along the 130m isobath (see plot with location attached).
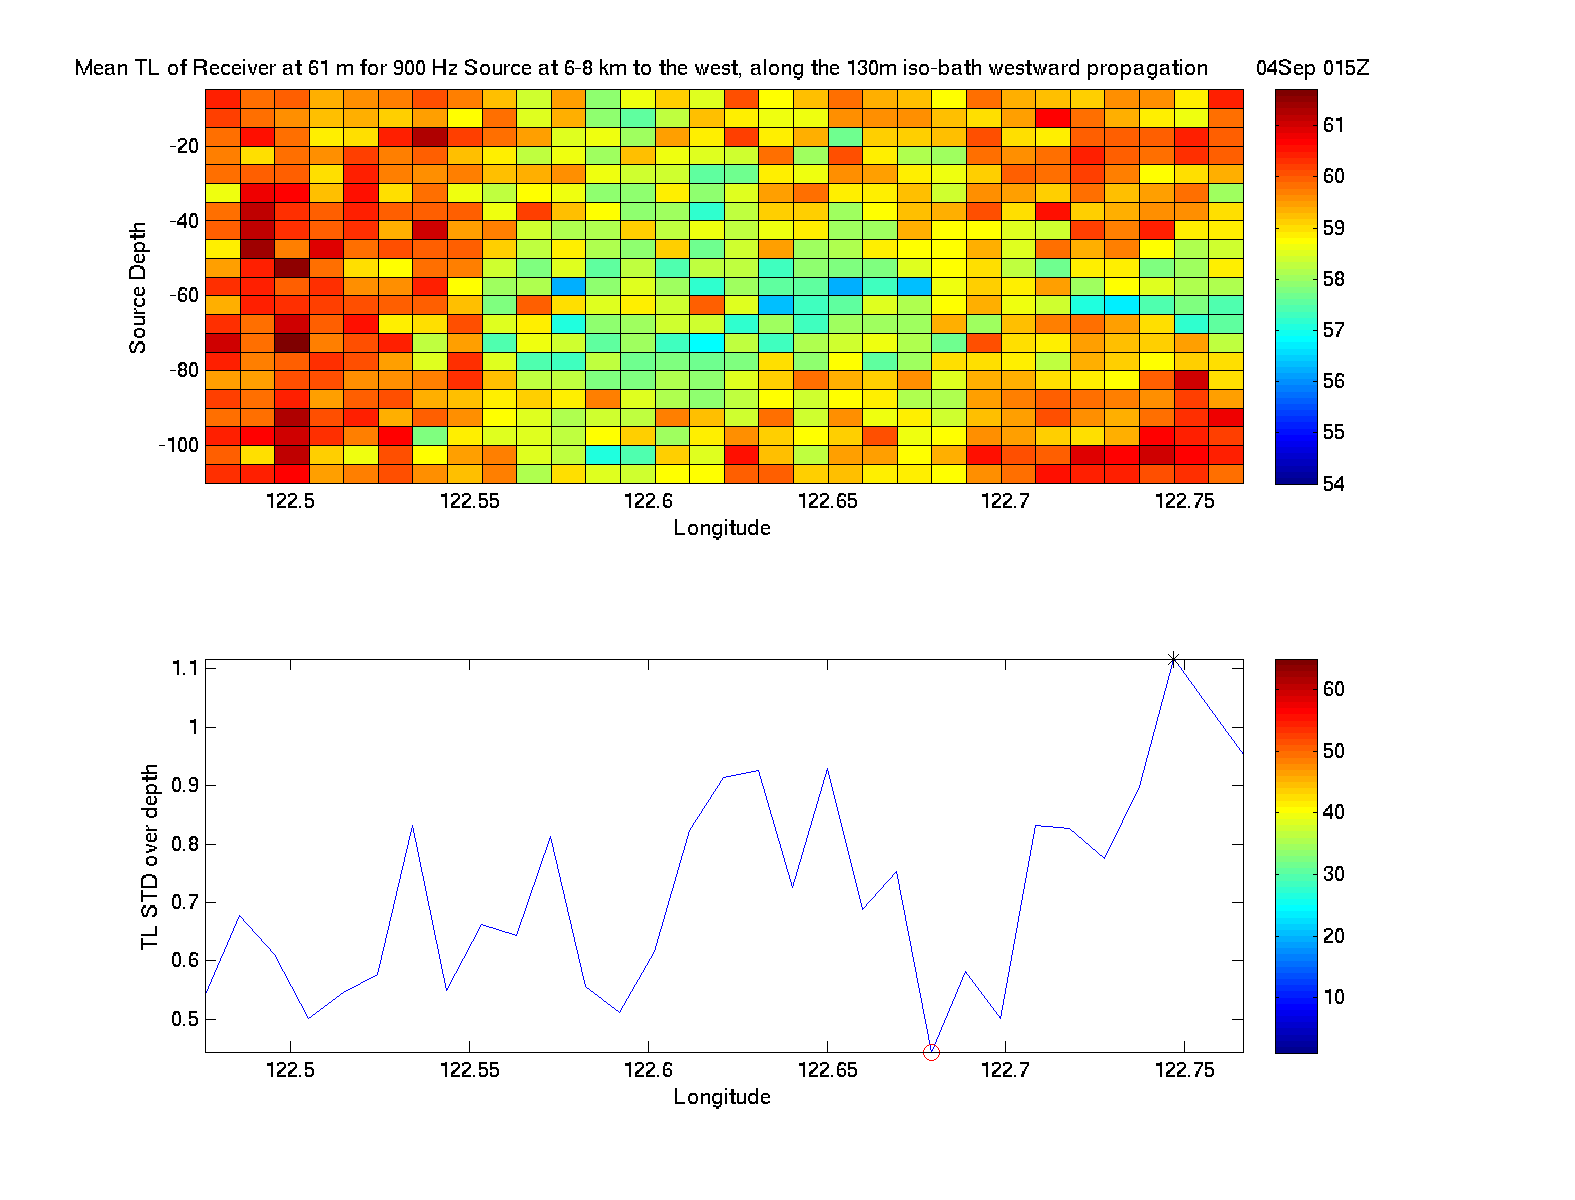
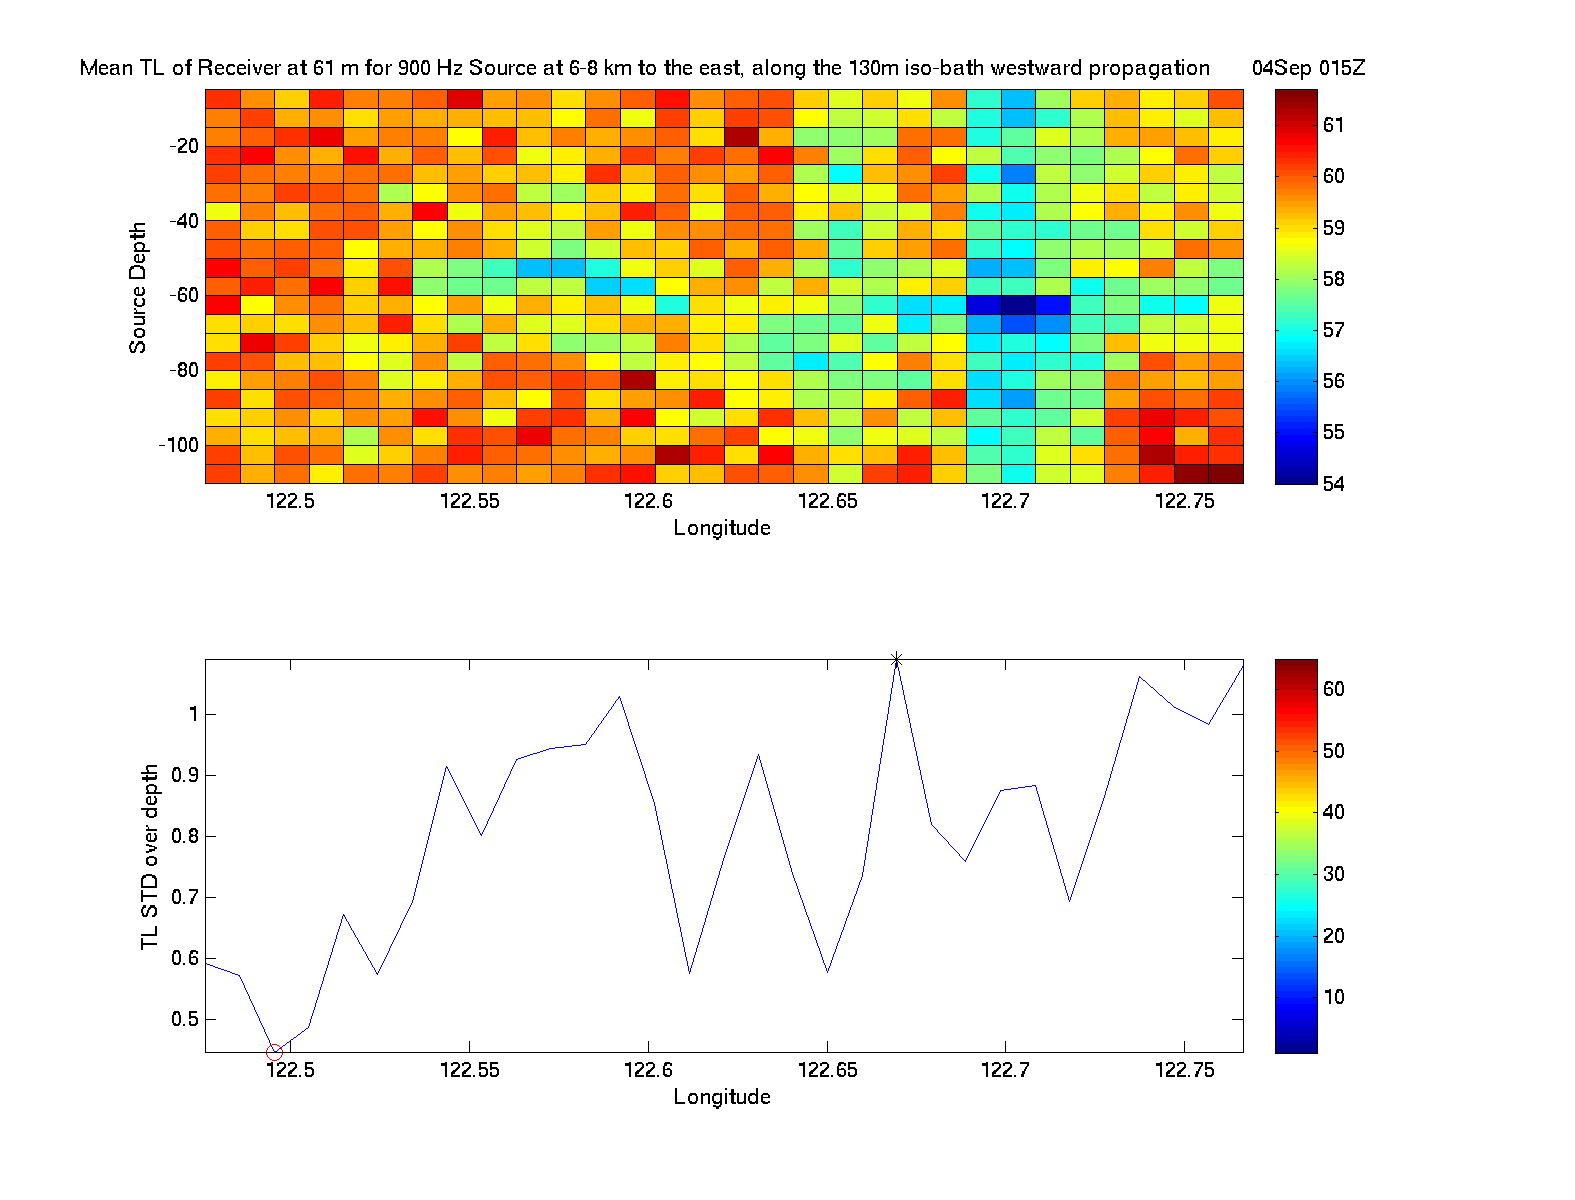
In these plots, we still use reciprocity. On two images, you have two vertical sections, which contain a 2D color plot and a 1D std over depth. One image corresponds to an eastward propagation, the other to a westward propagation. Consider the eastward propagation, for example. The 2D color section tells you that if the receiver is at that depth and lat-lon along the line (a pixel), it will hear a source at 6-8km to the west (to the left) with XX db (as colored in the pixel). Below, you have the standard deviation with depth. Similar things can be said for the westward propagation 2D plots.
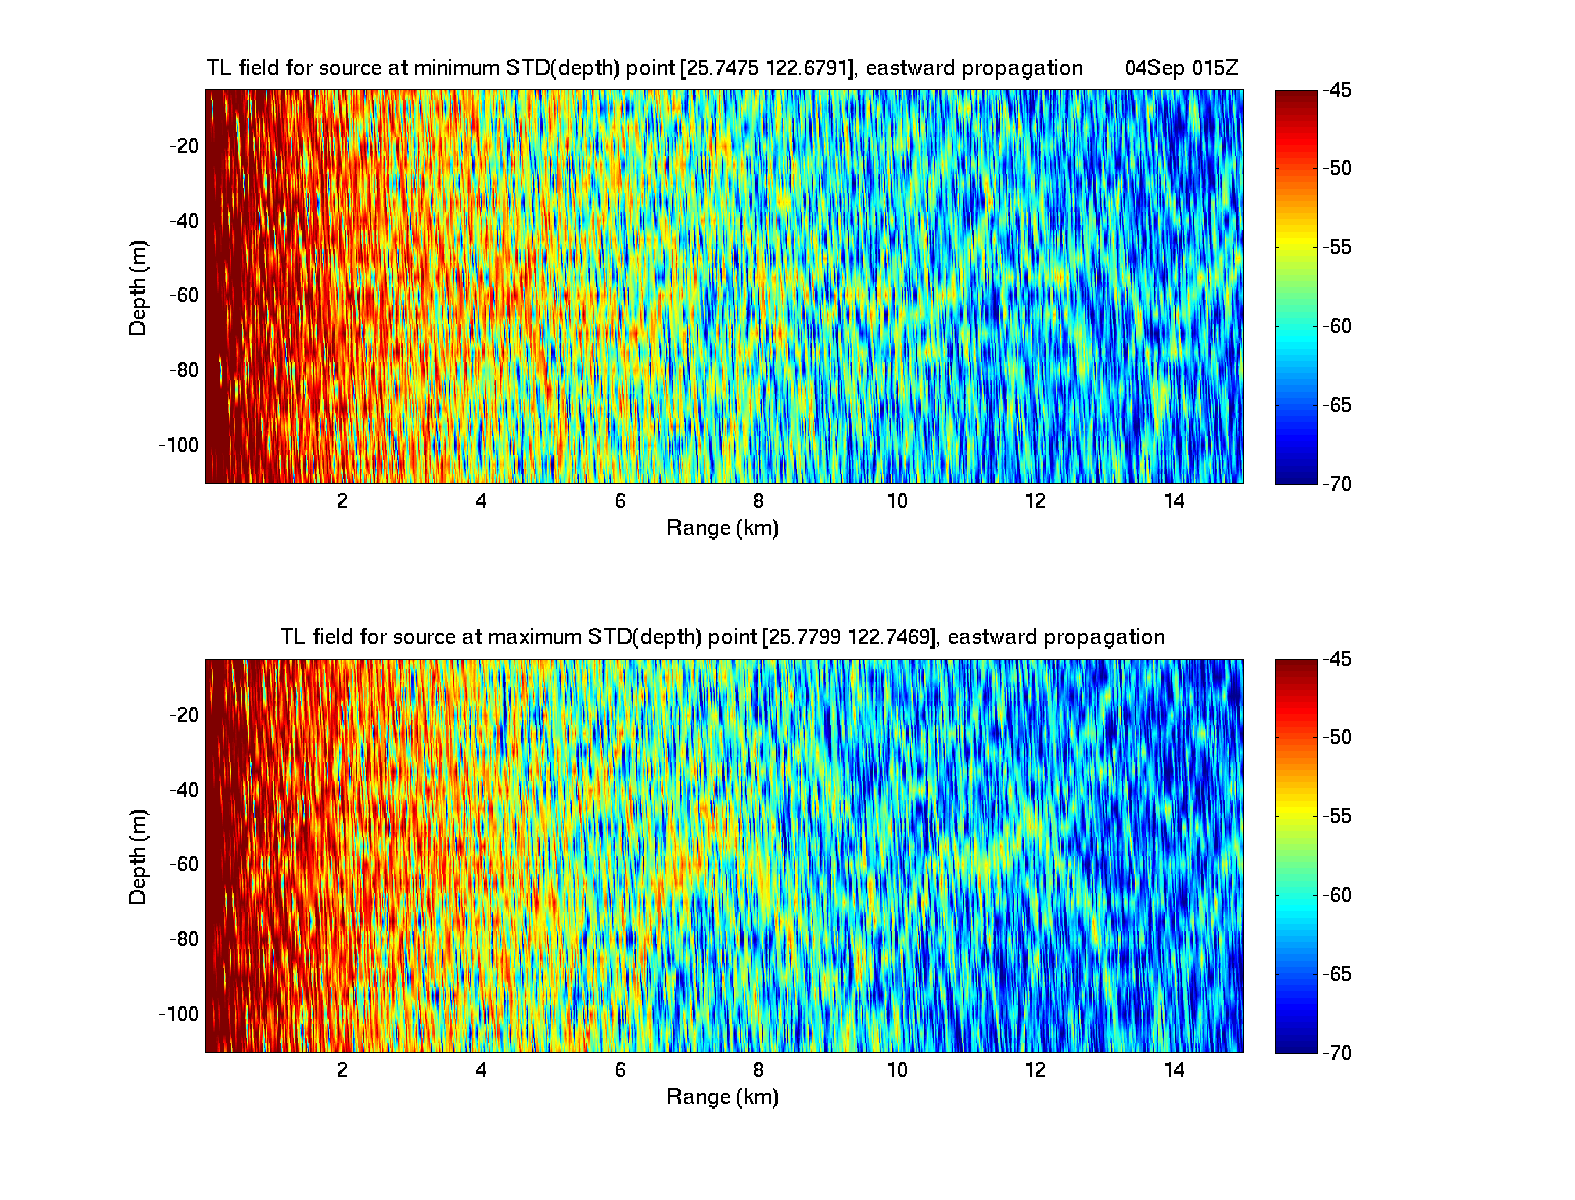
Then, we give the standard TL section plots, for a eastward propagation and for a westward propagation, selecting the location of maximum std with depth and the location with minimim std with depth. You could select either of them depending of what the goals are.
Comparing our forecasts for 15Z, 18Z and 21Z, the forecast indicate that propagation is better earlier (e.g. around 15Z than 21Z).
You could also decide to launch at a location for which the receiver will have minimum loss or maximum loss.
Of course, these are mean and variability estimates, which are both uncertain.
Right now, we are updating the acoustics map forecasts, see
http://mseas.mit.edu/Sea_exercises/QPE_IOP09/Acoustics/Sep04/index.html.
The summary page is also worked on in:
http://mseas.mit.edu/Sea_exercises/QPE_IOP09/Summaries/Sep04/index.html.
You have a link to a tar file with everything on that page including the html on that page.
Best wishes,
Pierre
Hi Glen and all,
We have updated the physics fields, plots and netcdf files, see
http://mseas.mit.edu/Sea_exercises/QPE_IOP09/Maps/Sep03/index.html.
The forecasts assimilate data up to 0800Z Sep 02 (for the ocean physics).
The cyclonic eddy observed in 2-6 days ago is now moving northeastward, but the cold dome is still there, being modulated by internal tides/waves in the forecast. By wind-driven and Ekman transports, the recent storm has strengthen southwestward transports in the Taiwan strait which may have strengthen the cold dome formation. Tidal velocities are getting stronger as we expected for a while. Note that velocities we plot are total velocities (including tides, mesoscale, etc).
For zoom estimates, including velocities which should help the OMAS runs, see:
http://mseas.mit.edu/Sea_exercises/QPE_IOP09/Maps/Sep04/025mZ/index.html
http://mseas.mit.edu/Sea_exercises/QPE_IOP09/Maps/Sep04/050mZ/index.html
Kevin: the model files are ready for you to use and on the web, in the format you want.
We are working on the daily summaries and on the acoustics forecasts using these new ocean forecasts The daily summary page will be in: http://mseas.mit.edu/Sea_exercises/QPE_IOP09/Summaries/Sep03/index.html. You have a link to a tar file with everything on that page including the html on that page.
Best wishes,
Pierre
Hi Glen and Chris,
Please find attached info on the acoustic forecast and adaptive sampling for day 1. The predictions are for 15Z, Aug 04, which is 2300 CST. Of course, 3h and 6h later, the situation will be different, but around 15Z, Aug 04, the forecast should be representative, with perhaps the mean off due to bottom uncertainties. All of the information is along the 130m isobath (or close to it, it is along a along-slope line in our horizontal map plots, see plot with location attached)
In these plots, we used reciprocity as I was telling Tim this morning on skype. I thought this would be less confusing for the user.
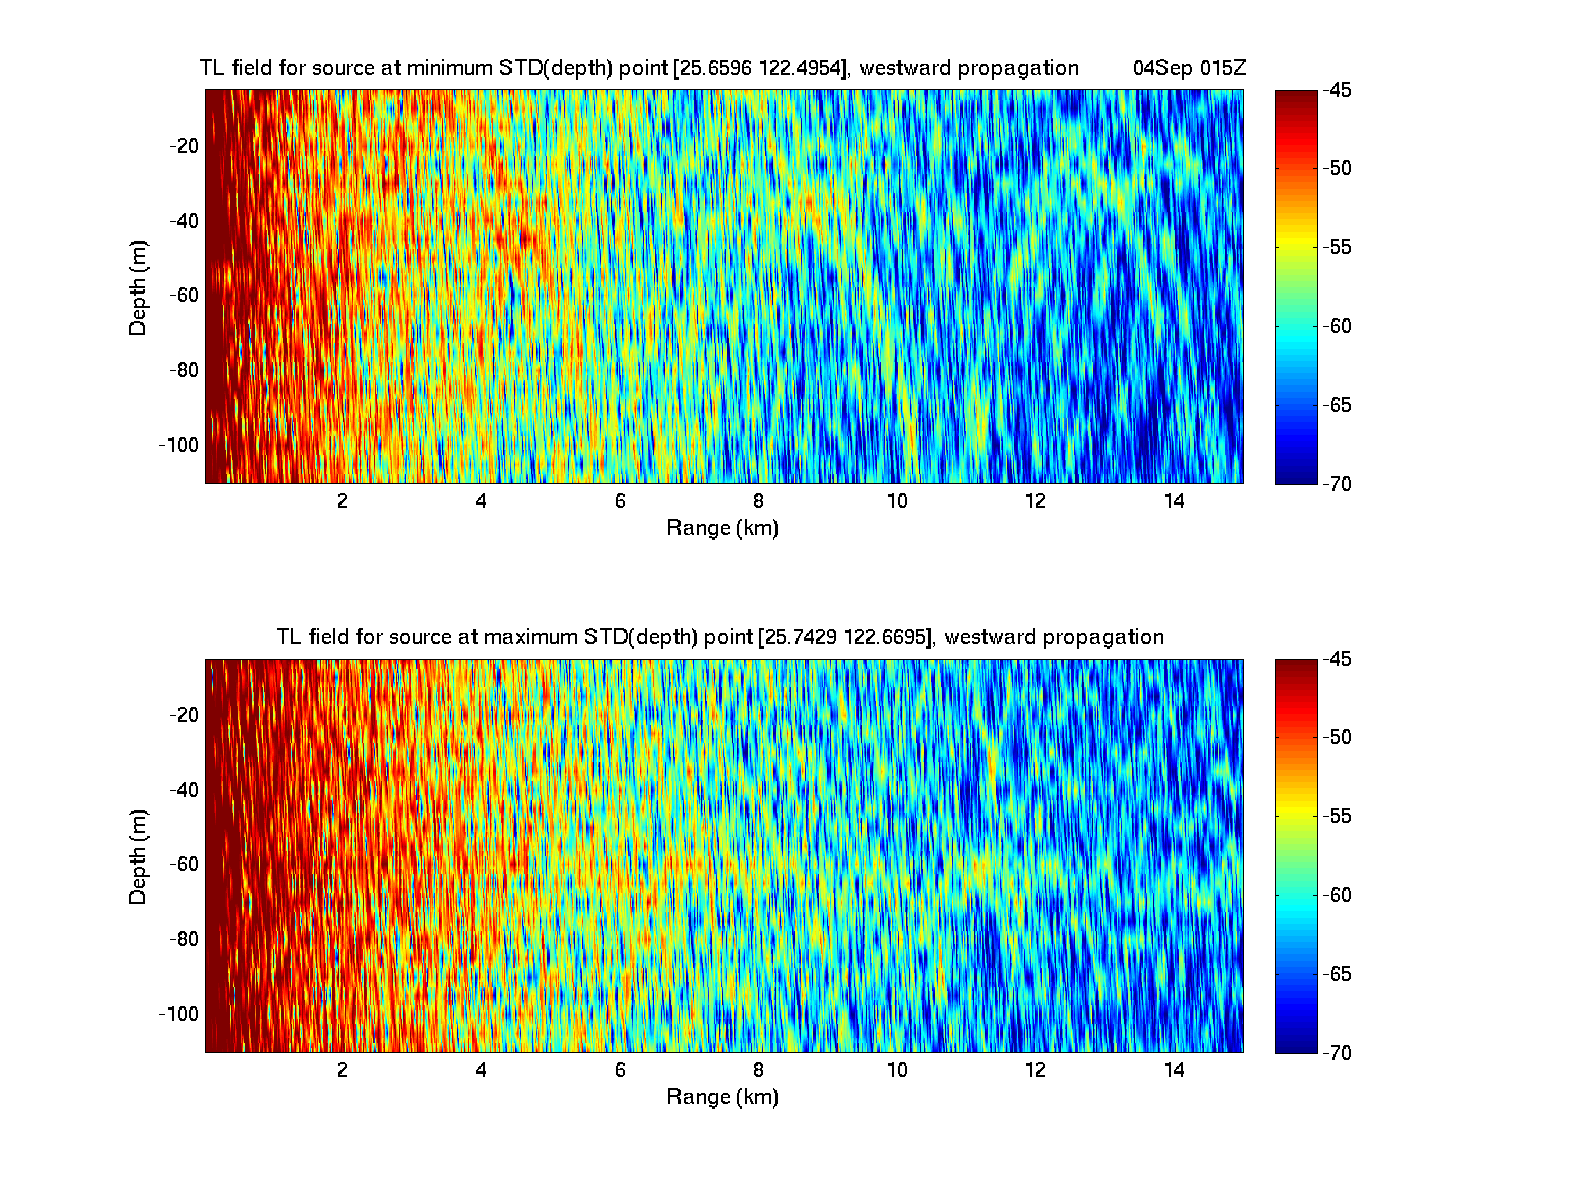
On two images, you have two vertical sections, which contain a 2D color plot and a 1D std over depth. One image corresponds to an eastward propagation, the other to a westward propagation. Consider the eastward propagation, for example. The 2D color section tells you that if the receiver is at that depth and lat-lon along the line (a pixel), it will hear a source at 6-8km to the west (to the left) with XX db (as colored in the pixel). Below, you have the standard deviation with depth. Similar things can be said for the westward propagation 2D plots.
Then, we give the standard TL section plots, for a eastward propagation and for a westward propagation, selecting the location of maximum std with depth and the location with minimim std with depth. You could select either of them depending of what the goals are.
| TL Vertical Sections - 4 September - 1500Z | ||||
|---|---|---|---|---|
| 130m Location | Mean Eastward Propagation | Mean Westward Propagation | TL Field Eastward Propagation | TL Field Westward Propagation |
 |
 |
 |
 |
 |
You could also decide to launch at a location for which the receiver will have minimum loss or maximum loss.
Note that all of this is a valid forecast around 15Z.
Of course, these are mean and variability estimates, which are both uncertain.
We have updated the acoustics map forecasts, see http://mseas.mit.edu/Sea_exercises/QPE_IOP09/Acoustics/Sep03/index.html.
The summary page is in: http://mseas.mit.edu/Sea_exercises/QPE_IOP09/Summaries/Sep03/index.html. You have a link to a tar file with everything on that page including the html on that page.
Best wishes,
Pierre
Hi Glen,
We have updated the physics plots, see http://mseas.mit.edu/Sea_exercises/QPE_IOP09/Maps/Sep03/index.html
We have added the zooms, you still have a nice cold dome as we had forecast, see:
Note that it seems it has gotten bigger, and the forecast still indicates formation time (it gets bigger in
the 2 days plotted for example).
For more plots, including velocities which should help for OMAS runs, see:
http://mseas.mit.edu/Sea_exercises/QPE_IOP09/Maps/Sep03/025mZ/index.html
http://mseas.mit.edu/Sea_exercises/QPE_IOP09/Maps/Sep03/050mZ/index.html
All the best for the cruise.
Pierre
|
Hello Jim and Frank,
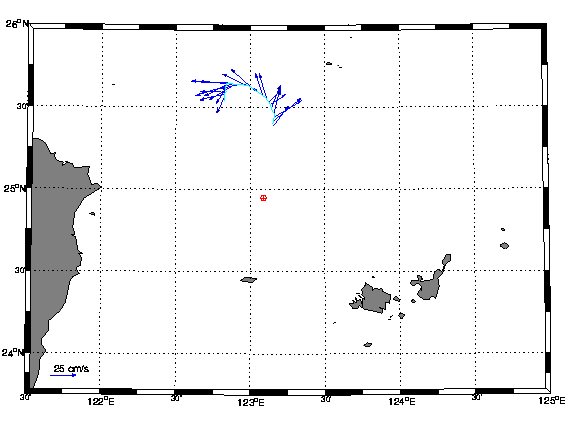
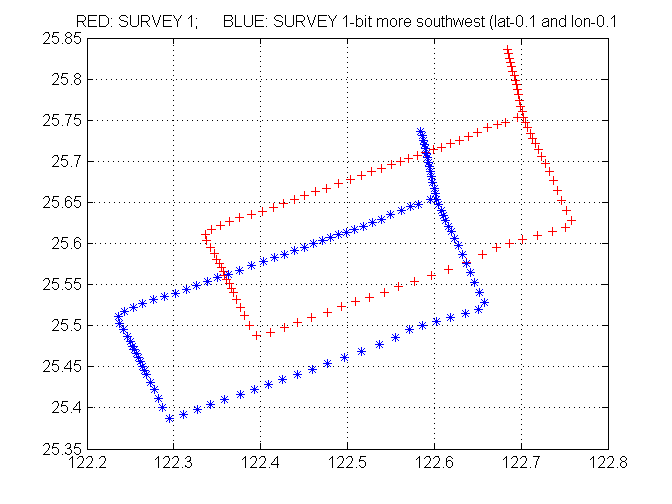
I checked the lat/lon of survey 1 (in red at right). This seems great. If it is somehow possible, to try to go a bit more to the southwest, I attached a new set of positions (in blue at right) for a modified survey 1.
Frank: to get the new blue track, here is what I did using your files
plot(txyz(:,2)-0.1,txyz(:,3)-0.1,'bx')which means -0.1 in both lat and lon.
The southwest corner of this new blue track should see something. Of course, I am not sure if you can do this (in light of fishing and other OPS constraints, etc). As long as you can go west enough, you should see something in the data (with currents to the northwest at 50m).
Here are some updated model fields (forecasts for 29 August): see the inflows of cold water (blue) just north of Taiwan.
| 09Z | 12Z | 15Z | 18Z | 21Z |
|

|

|

|

|
Hope this helps,
Pierre